
Vibe Coding A Custom Reporting App for Monday.com: A Guide for Non-Technical Users
If you’ve ever tried to pull a project report out of Monday.com, you know the drill. It starts with a simple “I’ll just check the design board.” Ten minutes later, you’re hopping between marketing, development, and half a dozen other side projects, cobbling together numbers that may or may not be current. By the end of it, you’re wishing for a custom reporting app to consolidate all screenshots, spreadsheets, and status updates into one accurate, automated report each week.
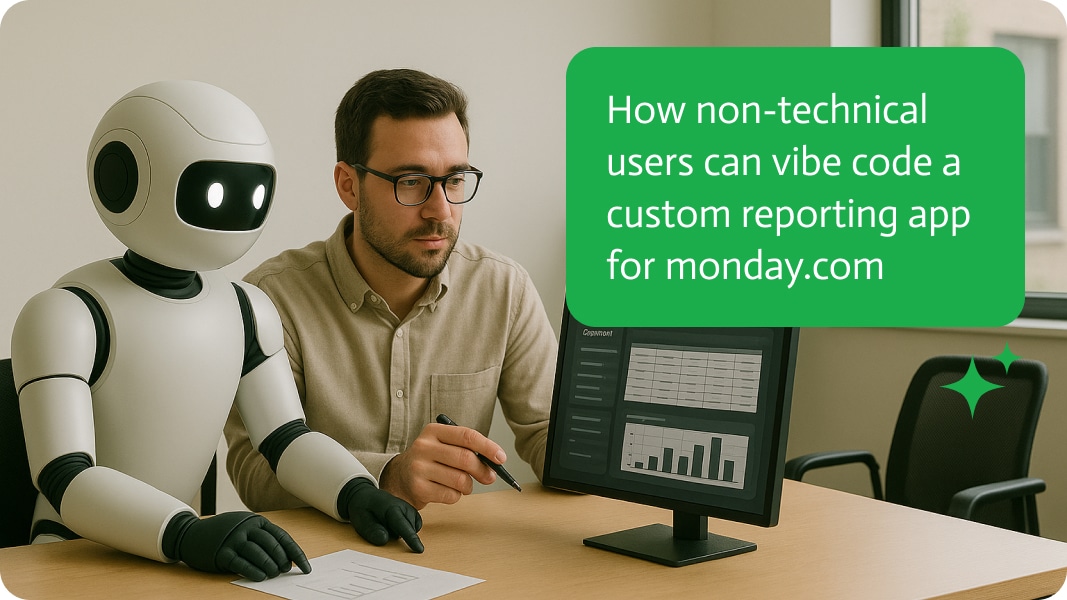
That’s the headache vibe coding is here to cure, and with Noca, you don’t need to be a developer, analyst, or even particularly “techy” to do it. You can literally tell it what you want, in plain language, and it builds the app for you. The end result is a clean, automated reporting tool that pulls from multiple Monday.com boards, formats the data, and exports it without you lifting more than a few fingers.
This guide shows you, step by step, how to vibe code your very first reporting app using Noca. By the time you’re done, you’ll have an actual working tool that solves one of the most annoying pain points in Monday.com: weekly project status reports that almost always involve juggling multiple boards at once.
Why Monday.com Reports Are Messy
Before diving in, it’s worth spelling out why this problem exists. Monday.com is fantastic for collaboration, but its reporting is certainly not the best, especially when all you want is a single consolidated view across boards.
Marketing wants their campaign KPIs, design wants hours logged and asset approvals, while development wants bug fixes, velocity, and sprint budgets. Each department tracks these differently, and Monday.com’s built-in dashboards don’t always give you the flexibility to combine everything easily.
That means most teams fall back on manual workarounds: downloading data into Excel, building custom tables, or probably nagging a developer to write an integration script. It’s repetitive, slow, and fragile. Enter vibe coding with Noca, a way to automate this without touching code.
Step 1: Define Goals For Your Custom Reporting App
The first step is always the hardest, but it’s also the most important. Be crystal clear about what your app should deliver. Noca thrives on specificity, so you don’t need tech jargon, however, you do need to articulate what the app should do in your own words, so make sure it makes sense.
For this guide, we’ll solve the exact problem we just described. Here’s a sample prompt:
“Create an app that aggregates task status, hours logged, and budget spend from my ‘Marketing,’ ‘Design,’ and ‘Development’ Monday.com boards and displays it in a weekly report for me to export.”
That’s it. One line. You’ve described the data you want, where it lives, and how you’d like it delivered. Remember that if your company has naming quirks (like calling your development board “DevOps” instead of “Development”), make sure you use the actual board names in the description
Step 2: Fire Up Noca
Now open Noca. If you’ve never used it before, you’ll need to link your workspace. Noca is designed with non-technical users in mind, so you won’t get buried in configuration menus or hidden setup wizards. You’ll land on a clean, text-driven interface that’s waiting for you to tell it what you want.
Paste in your description of the app. Hit enter. That’s all it takes to get the ball rolling.
Behind the scenes, Noca’s engine interprets your request, maps out the logic, and drafts a functional app. You don’t see code, because you don’t need to. What you see is a preview of your app’s purpose and workflow.
Step 3: Connect Your Monday.com Account
Here’s where the magic happens. Noca integrates directly with Monday.com, but first, authenticate your account.
Click Integrations in Noca’s sidebar. Choose Monday.com from the available connectors. You’ll be redirected to log in to your Monday.com account and asked to give Noca permission to ensure it can access the boards mentioned in your instructions.
But don’t worry, you always stay in control, just specify which boards and fields Noca is allowed to read or update. For this app, it just needs access to your marketing, design, and development boards. Once the connection is live, Noca automatically syncs the columns, statuses, and numeric fields from your boards.
Step 4: Mapping Data
Even though you wrote a plain-language prompt to flow, you still need to check how Noca interprets the details. Don’t worry, you won’t have to code, just type a few things.
For example:
- Task Status: Connect this to the “Status” column on each board.
- Hours Logged: Map to the “Hours” or “Time Tracking” column.
- Budget Spend: Map to the “Budget” or “Cost” column.
Noca will suggest matches automatically, but you get the final say. If your marketing board tracks hours under “Campaign Time,” just select that instead.
This is where non-technical users will truly see just how effective Noca is. Instead of wrangling formulas or SQL, you’re just confirming labels and clicking checkboxes.
Step 5: Building the App
Once you’ve approved the mappings, Noca compiles the app. You’ll see a dashboard preview with subsections of your boards rolled up into a single report view.
Expect something like this:
- Marketing Summary: Active tasks, hours logged this week, budget remaining.
- Design Summary: Completed deliverables, time spent, outstanding assets.
- Development Summary: Bugs closed, sprint hours, current budget spend.
- Overall Roll-Up: Totals across all three teams.
And because you asked for weekly reports, Noca automatically schedules the data refresh every seven days. You can make alterations where needed, like daily, monthly, or if you prefer, in real time.
Step 6: Export Options
Reports are only useful if you can share them. Noca builds in multiple export options right out of the gate. With one click, you can:
- Export as PDF for a polished report.
- Export as Excel/CSV if you need raw data for analysis.
- Share a live link with teammates who want to check the report live.
This will ensure that there are no more tedious back-and-forths of “Can you send me the latest numbers?” The app takes care of this autonomously.
Step 7: Test and Make Changes
Congratulations! You’ve built your first vibe-coded app. But don’t stop here. Now, run the report and see if the numbers look right.
If something doesn’t seem quite right, you can tweak the prompt or adjust the data. For example:
- Try adding a new metric: “Include average time it takes to complete a task.”
- Change the timeframe: “Show this as a rolling four-week trend instead of weekly.
- Refine the scope: “Exclude archived tasks from the report.”
Making these changes is as easy as typing in a new instruction, so you’re not actually editing any code, you’re simply explaining what you want more clearly.
Why A No-Code Custom Reporting App Matters
It’s easy to dismiss this new ability as some kind of novelty feature, but the implications are bigger than a single reporting app, and it’s proving to make a massive difference already.
- App creation for anyone: Non-technical employees are usually the ones closest to the actual project work, and now they can build their own solutions. No waiting for IT backlogs or expensive consultants.
- Faster feedback: If marketing needs an extra metric, they can simply add it today, not two weeks from now.
- Consistency and reliability: Reports get generated the same way every time, essentially eliminating annoying errors usually perpetrated by actual humans.
- Scalability: Once you’ve built one report, you’ll quickly see opportunities for others, think of stuff like client-specific dashboards or resource trackers.
New Use Cases For Your Custom Reporting App
After you’ve built a weekly status report, the door swings wide open to all kinds of possibilities:
- Cross-client reporting: Agencies servicing loads of clients can spin up apps that consolidate deliverables and budgets across accounts in no time at all
- Resource tracking: Add utilization rates. This is just to make sure you know who’s overbooked and who has capacity.
- Financial summaries: Roll up spend versus forecast across multiple teams for executive reviews.
- Goal tracking: Align board data with OKRs or KPIs to gauge whether projects are actually moving the needle.
Because Noca integrates with more than just Monday.com, you can eventually pull in external sources, analytics, or accounting software for far more comprehensive reports.
Final Benefits Of Your Custom Reporting App
What started as a vague need for “better reports” turns into a functional, reliable app in under an hour, all without writing a single line of code. Instead of burning hours every Friday cobbling together updates, you’ve got a living, breathing AI chat bot powered report generator that does it for you.
That’s the beauty of vibe coding with Noca. It puts custom app creation into the hands of the people who actually need it. Not developers, not consultants, just you and your team.
So, the next time someone complains that Monday.com makes it hard to see the big picture, you can just smile, download the report, and send it to them. Problem solved.


